
The LA Regional Food Bank Surveys College Students on Food Insecurity
The LA Regional Food Bank Surveys College Students on Food Insecurity
In 2022, the Los Angeles Regional Food Bank surveyed neighbors at four community college pantries across LA County. We received a total of 192 responses with 37 responses from Cerritos College, 39 responses from Compton College, 50 responses from Citrus College, and 57 responses from Pasadena City College. The questions we asked covered demographic information, food insecurity evaluation, overall economic circumstances, and distribution feedback. The information collected directly from community members is invaluable and helps us learn more about our community’s needs. This blog post will break down some key questions asked in the survey.
To start, here is a breakdown of the racial and gender demographics of survey respondents:
What is your race?
| Field | Choice Count |
|---|---|
| White | 29 |
| Black or African American | 23 |
| Asian | 71 |
| American Indian or Alaska Native | 5 |
| Middle Eastern or North African | 3 |
| Native Hawaiian or other Pacific Islander | 4 |
| Some other race or ethnicity | 40 |
| Don't Know | 10 |
| Prefer not to respond | 11 |
Are you of Hispanic, Latino, or Spanish origin?
| Field | Choice Count |
|---|---|
| Yes | 90 |
| No | 92 |
| Don't know | 2 |
| Prefer not to respond | 6 |
Do you currently describe yourself as male, female, or transgender?
| Field | Choice Count |
|---|---|
| Female | 89 |
| Trans female/Trans woman | 4 |
| Male | 78 |
| Trans male/ Trans man | 9 |
| Gender non-conforming | 4 |
| Prefer not to respond | 6 |
Respondents were asked how many other people live in their households and how many members of their household are under eighteen years old. Even though this survey was at community college sites, we quickly learned that there were many community members also visiting the distribution, including staff of the college.
Not counting yourself, how many other people live in your household at least 4 days out of the week?
| Field | Choice Count |
|---|---|
| No one. I live by myself. | 29 |
| 1 | 8 |
| 2 | 31 |
| 3 | 27 |
| 4 | 37 |
| 5 | 31 |
| 6 | 12 |
| 7 | 6 |
| 8 | 5 |
| 9 | 1 |
| 10 | 1 |
| Don't Know | 2 |
Of the other people who live in your household, how many of them are children under the age of 18?
| # of people <18 | Responses |
|---|---|
| 0 | 77 |
| 1 | 29 |
| 2 | 31 |
| 3 | 14 |
| 4 | 2 |
| 5 | 2 |
| Don't Know | 5 |
| Prefer not to respond | 3 |
We also asked how what mode of transportation was used to travel to the distribution sites. Despite high gas prices many clients still relied on a car to access the distribution. The majority of respondents answered that they drove themself. The next two most used methods of transportation were ‘get a ride with family or friends’ and ‘take one bus or train’. Only one person answered ‘take a taxi or rideshare (Uber or Lyft)’.
Out of all respondents, 108 were attending the distribution for the first time, and for 78 respondents, this was not their first time. Most community members gave positive feedback about the distributions and how they were treated while visiting. Responses to the question ‘On a scale of 0 to 10 where 0 means not at all likely, and 10 means extremely likely, how likely are you to recommend this food program to a friend or family member?’ were very positive. Over 70% of respondents responded that they would be extremely likely to recommend this program. And 155 clients reported that they felt like they were treated well or very well when visiting the distribution.
We also asked some questions about the quality of food received at the distribution. Most respondents agreed that the fruits and vegetables served at this program are of good quality. Participants also agreed that they enjoyed trying new fruits and vegetables that they received from the distribution.
We also asked clients some questions about CalFresh/ SNAP. Most respondents reported that nobody in their household was currently receiving CalFresh/ SNAP.
| Field | Choice Count |
|---|---|
| Yes | 40 |
| No | 124 |
And of those 40 who do receive SNAP, only one person said that their benefits lasted the month. There were 10 respondents whose benefits lasted one week or less, 17 whose lasted 2 weeks and 9 whose lasted 3 weeks. This question is important for us to learn more about how community members are using a combination of SNAP benefits and visiting our pantries to get food for their households. It also shows that there is a large percentage of community members who are not currently receiving CalFresh but could be eligible.
A large percentage of the survey asked questions regarding food insecurity. This information can give us insight into the challenges that community members are currently facing. Participants were asked to rank the following statements regarding their household’s financial situation.
These graphs show that the majority of people would have difficulty handling a major expense at this time and are insecure about their financial futures. We also asked several questions regarding food in the household. Although we already know that prices have gone up and many households are struggling with basic expenses, these questions give us deeper knowledge about how our community is feeling and how they are handling uncertainty and high prices.
Finally, we gave participants the chance to submit some comments. Here are some short answer responses directly from clients.
- I’ve always enjoyed coming to these food drives because the staff and the food are both very good to me.
- Everybody was super welcoming the food was nice and fresh.
- Didn’t feel ashamed to get food because they were giving it out to everyone
- My family relies a lot on food stamps. They give us money so that we can eat food.
- It feels nice for my school to help me out with little needs that can do a lot for my family! Helps us with the time and money spent going grocery shopping and helps us save what we can!
- Overall we received positive reviews and helpful feedback regarding our distributions. We were able to gain insight into a snapshot of life and the challenges experienced by our neighbors.
Thank you to all who participated in this survey, this information helps us to better understand our community college pantries and distribution sites. Please feel free to contact Derek Polka or Bella Mullen if you have any questions regarding this survey.
More Stories from the LA Regional Food Bank
Why Summer Meals Matter, and How the Food Bank Is Closing the Gap
Summer break can mean hunger for many food-insecure children. Learn why summer meals matter and how the Food Bank is helping make summer hunger-free.
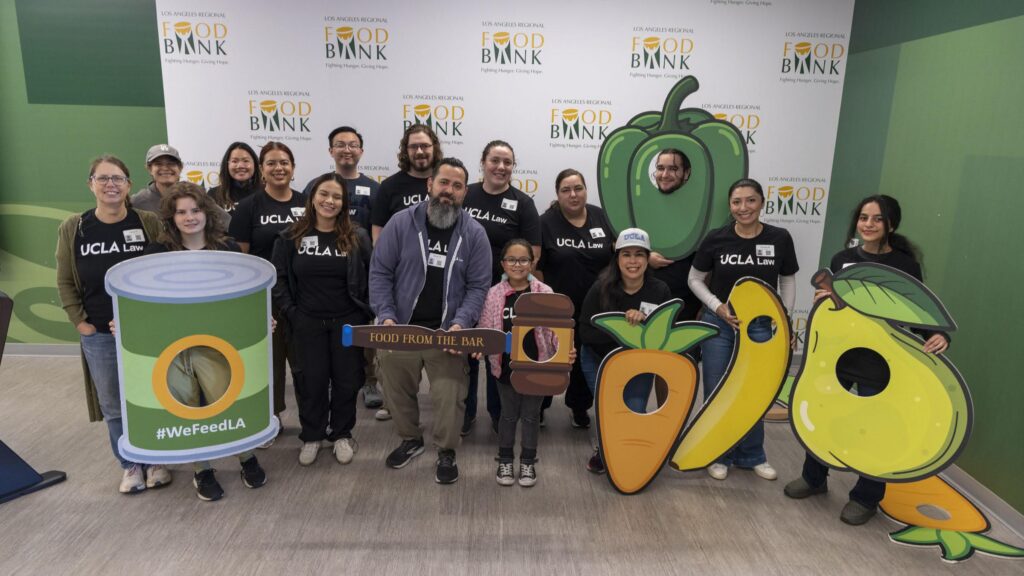
Eighteenth Annual Food From the Bar Campaign Raises $490,000 for Food-Insecure Neighbors
For over 15 years, the Food From the Bar Campaign has raised more than $8 million for Food Bank programs.
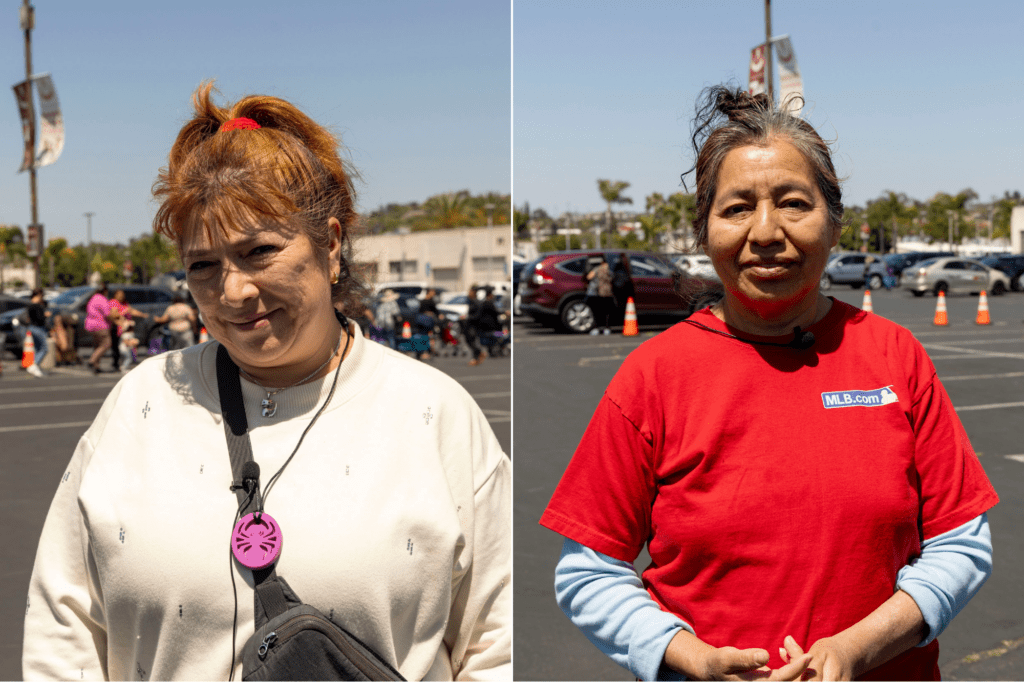
Every Neighbor Has a Different Story: How the Food Bank’s Mobile Food Pantry Provides Hope During Life’s Challenges
Blanca and Silvia may not know each other, but life’s circumstances have led both to receive food assistance at the Food Bank’s Mobile Food Pantry.

Nourishing Student Success: How the Food Bank’s Mobile Food Pantry Program Helps Students Like Jaime
The Mobile Food Pantry at Long Beach City College helps community members and students like Jaime get the food assistance they need to thrive.